Site Description
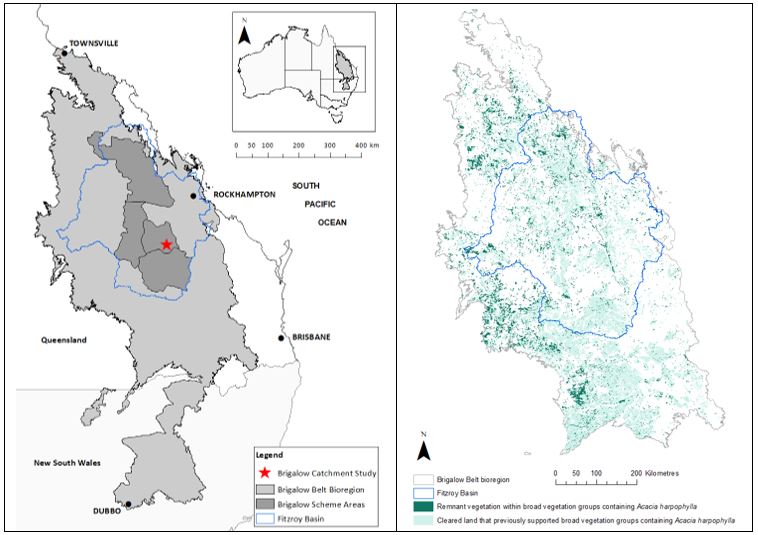
The Brigalow Catchment Study (24°48’S and 149°47’E) is a paired, calibrated catchment study located near Theodore in the Fitzroy Basin of central Queensland, Australia (Figure 1). It was established in 1965 to quantify the impact of land development for agriculture on hydrology, productivity, and resource condition. The study site was selected to represent the Brigalow Belt bioregion which covers an area approximately 36.7 Mha from Townsville in north Queensland to Dubbo in central-western New South Wales.
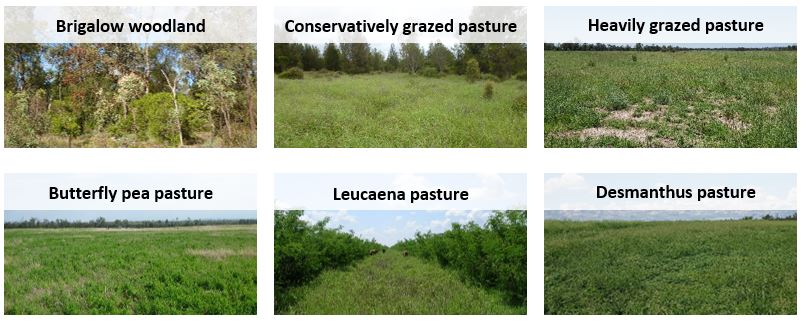
The site in its native condition was dominated by brigalow (Acacia harpophylla), either in a monoculture or in association with other species, such as belah (Casuarina cristata) and Dawson River blackbutt (Eucalyptus cambageana). The extant uncleared vegetation at the Brigalow Catchment Study is classified as regional ecosystems 11.4.9 [Acacia harpophylla shrubby woodland with Terminalia oblongata on Cainozoic clay plains, 60%] and 11.4.8 [Eucalyptus cambageana woodland to open forest with Acacia harpophylla or Acacia argyrodendron on Cainozoic clay plains, 40%]. This association of vegetation is colloquially known as brigalow scrub.
Slope of the land averages 2.5% (range 1.8 to 3.5%), and soils are an association of Vertosols, Dermosols, and Sodosols. The region has a semi-arid to subtropical climate with a mean annual hydrological year (October 1965 to September 2017) rainfall of 650 mm at the site.
Experimental Stages
The Brigalow Catchment Study can be separated into four experimental stages:
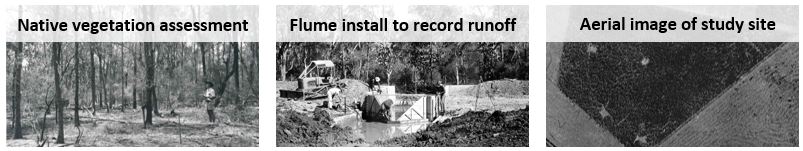
- Calibration of three catchments in virgin condition from 1965 until 1982 (Figure 2). Rainfall and runoff were monitored to determine hydrological relationships between these catchments.
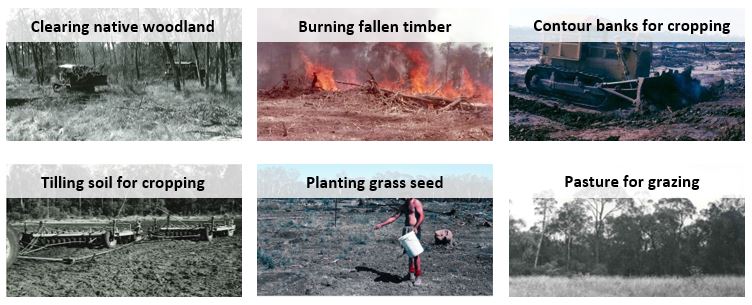
- Development of two catchments for agriculture from 1982 until 1983 (Figure 3). One catchment remained virgin brigalow woodland to provide a control treatment and the other two catchments were cleared by bulldozers and a chain with the fallen timber burnt. One of the cleared catchments was developed for cropping with the construction of contour banks and grassed waterways while the other was developed for grazing by the planting of improved grass pasture.
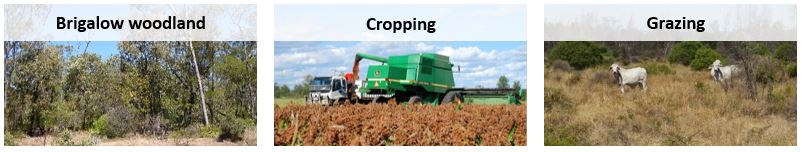
- Land use comparison from 1984 until 2010 (Figure 4). Hydrology (rainfall, runoff, and water quality), productivity (crop yields and cattle weight gain), and resource condition (soil fertility and pasture biomass) were monitored in the virgin brigalow woodland, cropped and grazed catchments. No fertiliser application or supplement feeding has occurred in either agricultural catchment.
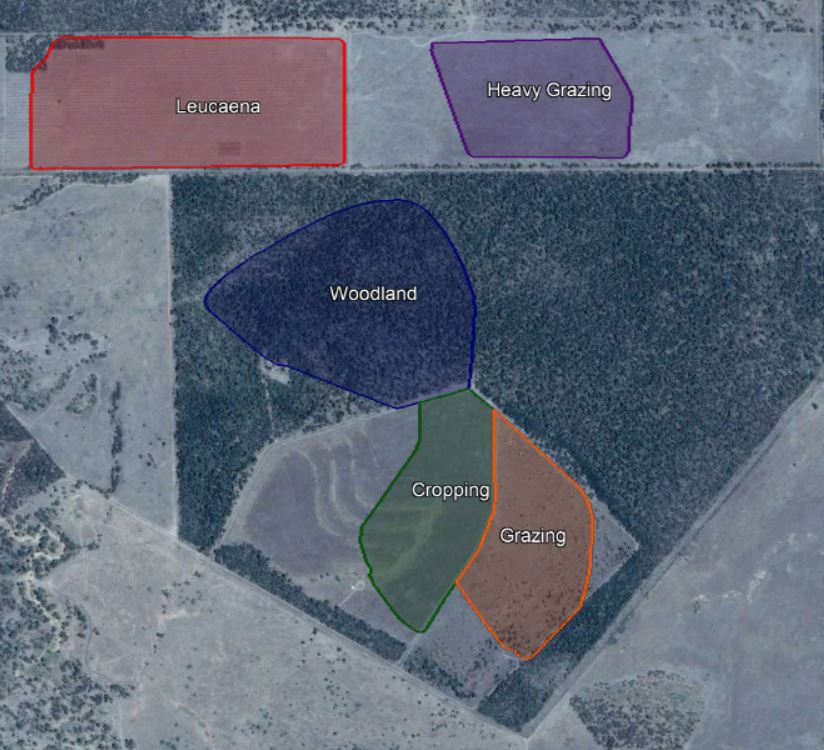
- Adaptive land management from 2010 to present (Figure 5). The cropping catchment from Stage III had a butterfly pea ley pasture planted while the grazing catchment continued as a conservatively grazed improved grass pasture, but with wet season spelling incorporated into the management philosophy. Two new catchments were also added to the study, which were a leucaena improved grass pasture and a heavily grazed improved grass pasture. Hydrology, productivity, and resource condition were monitored from all five catchments (Figure 6). In 2018, the butterfly pea ley pasture was replaced with a desmanthus improved grass pasture.
Further details on the experimental design of the long-term Brigalow Catchment Study and land use history of the five catchments currently monitored are documented in other sources on the publications page.